visualization porn
Tag: visualization
CO2 Visualization
shows you C02 emissions when you are on a travel site. smart!
Maps Timeline Mashup

Just over a month ago, I posted about Visualising Geo-temporal RSS Feeds, in which I pondered on various mashup interfaces that could be used to display data contained in an RSS feed on a split view containing a timeline visualisation of the feed items, as well as a map view depicting the geo-location of each item, like this Earthquake mashup by Jörn Clausen which combines a Simile timeline with Google map:
musing on a possible timeline UI for gmaps
US Self-Portrait
Each image portrays a specific quantity of something: 15M sheets of office paper (5 minutes of paper use); 106K aluminum cans (30 seconds of can consumption) and so on.
Wow. Mind-boggling.
Cans Seurat, 2007

2022-03-04: A conceptually similar piece:
These images combine photography and computer generated elements in an effort to visualize the output of various mines in South Africa. The CGI objects represent scale models of the materials removed from the ground. By doing so, the intention is to create a kind of visualization of the merits and shortfalls of this industry that has shaped the history and economy of the country so radically.


China Cities
Sinocity, a fictitious city in an imaginary Chinese province, reflects more reality of mid-sized Chinese cities than many will admit. The Sinocities Awards seeks to explore awards ways of dealing with this status quo of the near future.
2010-09-02: 1b city by 2040
Going to 2400 km/h in the 2030 to 2040 timeframe would enable 90% of China’s population to be 1 hour apart by low pressure maglev.
2015-04-02: City Hypergrowth. While not quite the fastest growing at 200k people / year vs Karachi at nearly 1m / year, these pictures of rapid transformation are still interesting.

Tim Franco captures the massive urbanization of Chongqing, which has been described as “the biggest city you’ve never heard of” and “China’s Detroit.”
2017-04-02: Megacity integration
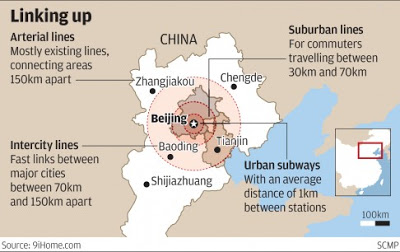
China is breaking the administrative barriers between Beijing-Tianjin-Hebei. This will enable coordinated development. Transportation, education, medical, economic, ecological services are moving towards integration in the cities which make up the 130M Jing-jin-ji megacity area.
2017-07-13: China Megacities
Chinese megacities are associated with the greatest migration in human history, namely the movement of several 100M people from the countryside into urban areas. This has created over 100 cities with a population of more than 1M. And while Westerners tend to see only the harmful effects of that transformation, it’s gone fairly smoothly. Wages and living standards have risen to create the biggest rapid boost in prosperity the world has seen, ever. Surely it’s worth taking a closer look at that.
If you spend a few days in these places, they will stand out as quite distinct. To suggest otherwise is actually to repeat a common Western imperialist meme about the Chinese, namely that they “are all the same” in some underlying manner. Observing and understanding diversity is a skill, and the Chinese megacities are one of the best places for cultivating this capacity.
2018-07-03: Faster commutes are key for integration
It seems clear that China will continue to leverage technology to enable faster commuting within city regions.
- more high-speed rail lines
- robotic buses
- robotic cars and ridesharing with high-speed roads and tunnels
- ultra-fast elevators to commute from skyscraper to skyscraper and to speed the last 300 meters.
China will do what takes to get the potential 50% GDP boost from truly efficient 1-hour connections.
2018-09-04: China Urbanism
China is creating 19 supercity clusters by strengthening the links between existing urban centers. The supercities will have 800m people and more than 80% of the country’s GDP in 2030. 287m people have moved from low-income agriculture to higher-income city industries, the largest population transfer in history. Another 40m people will migrate to cities by 2020 and the productivity gap will have more than halved since 2000.
GeoCommons
there is going to be lots of content to play with – there are 2B location attributes, 25M locations, 35K variables describing a set of locations, and 1500 unique datasets of information.
Avian flu in Google Earth
A comprehensive phylogenetic visualization of the avian flu virus has just been published and its centerpiece is a KML file that shows the evolution of the virus as it travels out of East Asia and into Europe and Africa
Science In Silico
Computer simulations and visualizations are performing the thought experiments of the 21st century and pushing the limits of human vision and imagination.
Critical Life Path
a fascinating diagram of events in the life of a fictional designer living from 1990-2090. It mixes personal development (“Learn early networking skills at kindergarten”, “Go back to school and study nanotechnology”) and trends (“Child plays with HAM II: mother-in-law objects”, “24-hour business and recreation hubs”, “Prada fashion and Monsanto agribusiness join forces for hostile takeover of big corporation”), showing how they affect each other.
amusing futurist visualization
Census Migration Analysis
amazing.
New Englanders appear to be moving to Florida, Arizona, and California in droves. Chicago & Seattle get a fair number as well.
